#Was spring 2021 unusual in Paris?
Introduction
The first half of 2021 felt odd in Paris: snow in February, summer temperatures at the end of March, a freezing April, a grey May, and storms in June. Was it really unusual, or does every spring feel like that?
To check, I compared each day of January to June 2021 with the same day in the 30 previous years, 1991 to 2020: the period that weather services use as the current "normal".
Data
Météo-France publishes the daily climatological data of all its stations, with one file per département. For Paris (75), the file covering 1950 onward weighs 4 MB and holds about forty stations, most of which only operated for a few years. The reference one is Paris-Montsouris (station 75114001), in the park of the same name, complete since 1950.
Three columns are enough: the minimum temperature TN, the maximum temperature TX, and the rain RR, in millimetres, from 6am on one day to 6am on the next.
import pandas as pd

df = (
    pd.read_csv('Q_75_previous-1950-2024_RR-T-Vent.csv.gz', sep=';',
                usecols=['NUM_POSTE', 'AAAAMMJJ', 'RR', 'TN', 'TX'],
                dtype={'NUM_POSTE': str})
    .loc[lambda x: x['NUM_POSTE'] == '75114001']  # Paris-Montsouris
    .assign(date=lambda x: pd.to_datetime(x['AAAAMMJJ'].astype(str)),
            year=lambda x: x['date'].dt.year,
            month=lambda x: x['date'].dt.month)
    .loc[lambda x: x['month'] <= 6]
)

ref = df.loc[df['year'].between(1991, 2020)]
cur = df.loc[df['year'] == 2021]Month by month
For each month, the average daily maximum and minimum temperatures, the total rain, and the number of rainy days (at least 1 mm), in 2021 and on average over 1991–2020:
monthly = (
    df
    .groupby(['year', 'month'])
    .agg(TX=('TX', 'mean'), TN=('TN', 'mean'), RR=('RR', 'sum'),
         rain_days=('RR', lambda s: (s >= 1).sum()))
)
normals = monthly.loc[1991:2020].groupby('month').mean()| Month | Max temp. 2021 | Normal max | Min temp. 2021 | Normal min | Rain 2021 | Normal rain | Rainy days 2021 | Normal rainy days |
|---|---|---|---|---|---|---|---|---|
| Jan | 7.2 °C | 7.6 °C | 3.2 °C | 3.2 °C | 91 mm | 48 mm | 15 | 10 |
| Feb | 10.2 °C | 8.8 °C | 4.2 °C | 3.3 °C | 50 mm | 41 mm | 10 | 9 |
| Mar | 13.6 °C | 12.8 °C | 4.9 °C | 5.6 °C | 37 mm | 45 mm | 12 | 9 |
| Apr | 15.4 °C | 16.6 °C | 5.4 °C | 7.9 °C | 31 mm | 46 mm | 2 | 9 |
| May | 18.1 °C | 20.2 °C | 9.3 °C | 11.1 °C | 64 mm | 69 mm | 13 | 9 |
| Jun | 25.1 °C | 23.4 °C | 15.8 °C | 14.2 °C | 112 mm | 51 mm | 13 | 8 |
Over the six months, the average maximum temperature was exactly normal (15.0 °C, against 14.9 °C), but this average hides two opposite halves: a mild February and March, then a cold April and May. And it rained 385 mm, 28% more than normal, the 10th wettest first half of the year since 1950.
Temperatures
To see the daily variations without the noise, the chart shows the 7-day average of the maximum temperature. The grey band covers 80% of the years 1991–2020 for each day: outside it, the weather is unusual for the season.
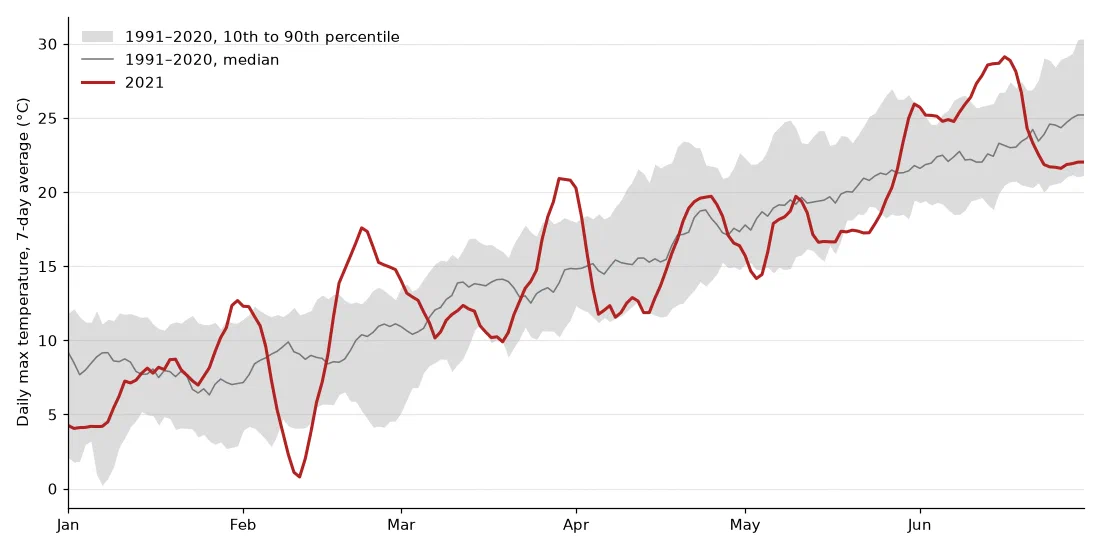
Three episodes leave the band:
- The cold snap of February: from February 8 to 14, the temperature never went above 3 °C, with −5.7 °C at night on the 10th, and snow on the ground.
- The heat of late March: 26.0 °C on March 31, the warmest March day at Montsouris since at least 1950 (the previous record was 25.7 °C). Followed a week later by 9.9 °C on April 7: a drop of 16 degrees.
- June: warm in the middle of the month, around 29 °C, before a cooler end.
April deserves a closer look. Its days were only a little colder than usual, but its nights were the coldest of any April since 1991 (5.4 °C on average, against 7.9 °C). Across France, the frosts of early April destroyed a large share of the fruit and wine harvests that year; in Paris itself, warmer than the countryside, the temperature stopped at 0 °C.
Rain
The second chart adds up the rain since January 1st: one grey line for each year from 1991 to 2020, and 2021 in blue.
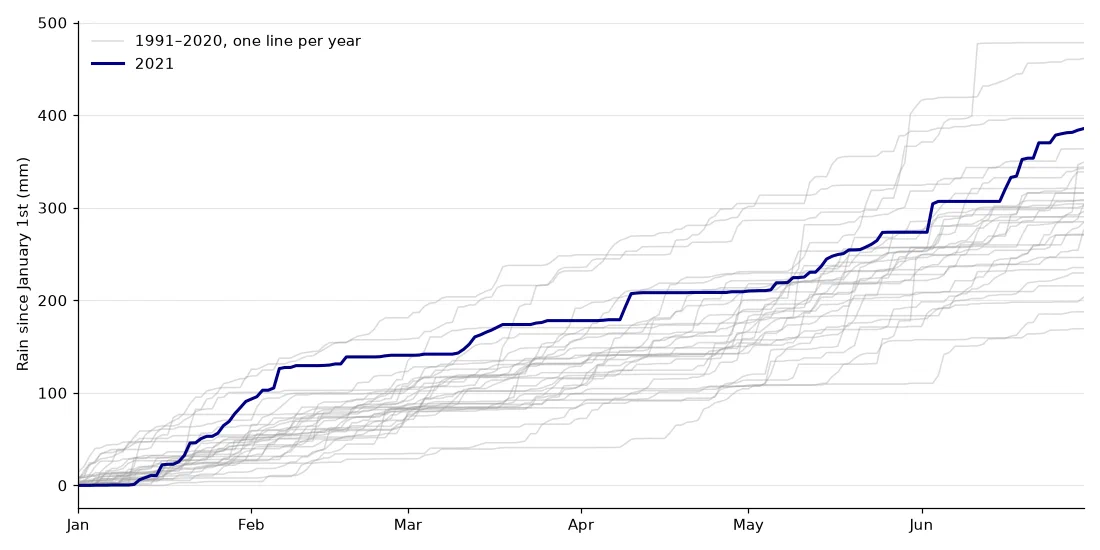
2021 starts high, with a January almost twice as wet as normal, then flattens out: in April, only two days had more than 1 mm of rain, April 9 and 10. The gap comes back in June, a month of thunderstorms: 112 mm in total, including 31 mm on June 3 alone, the 3rd wettest June since 1950, after 1997 and 1958 (and level with 2018).
So, was it unusual?
On average, not really: the temperatures of the half-year were normal. What made it memorable is the succession of extremes, each within a few weeks of the opposite one: a cold snap followed by a record heat in March, then the coldest April nights in thirty years, then one of the wettest Junes on record. An average over six months flattens all of this, which is why looking at days, rather than months, gives a much better picture of what people actually lived through.