#Building a 3D atlas of Paris as model benchmark
Public AI benchmarks are viewed with a lot of skepticism these days. That's why having personal benchmarks is useful: you test new models on the same problems and make up your mind.
So here it is, my own benchmark, like Simon Willison's famous "pelican on a bike", but more computationally expensive. I asked several models to create a detailed 3D interactive atlas of Paris, with buildings colored based on their construction period.
You can see the full results here: lassence.net/demos/benchmark
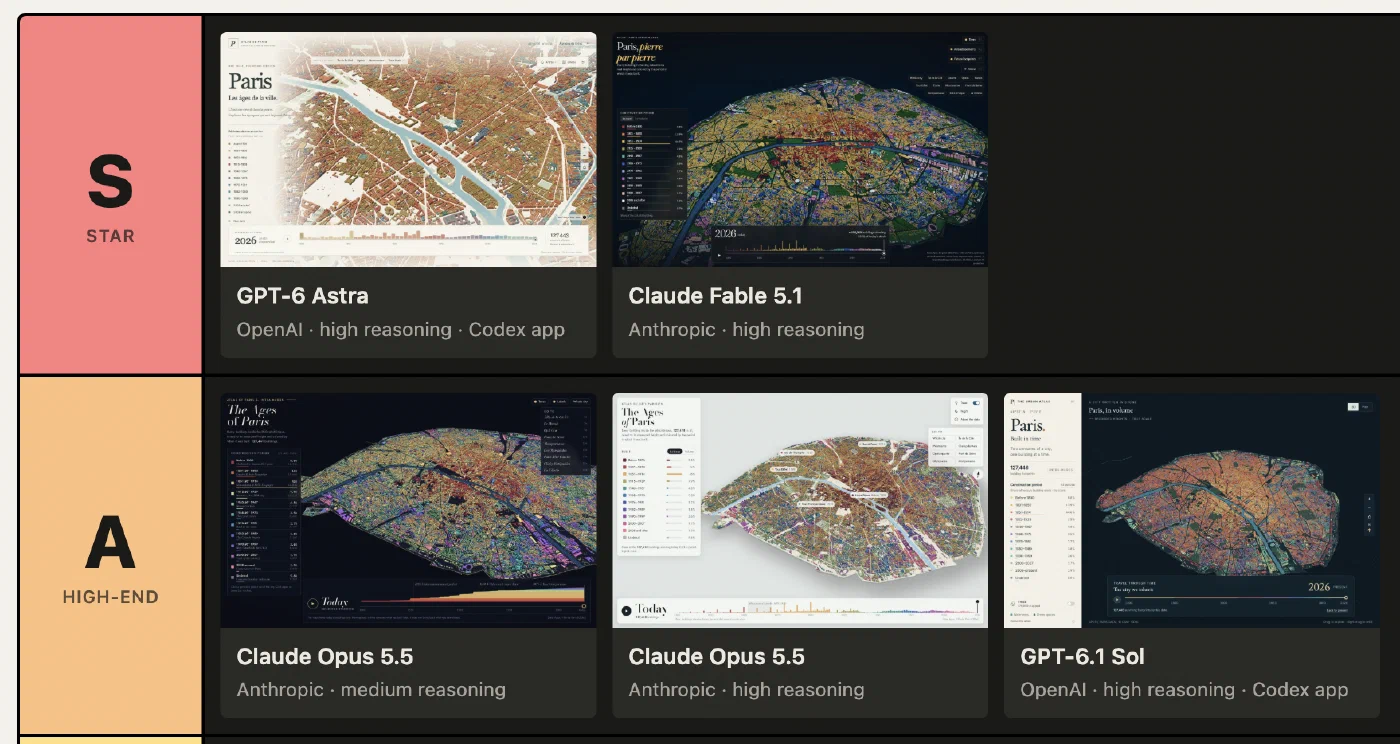
All 7 models were run through Claude Code or Codex as the harness. Overall, the progress in a year is impressive. The task is not straightforward: the agent needs to download the data, extract and prepare it, create the 3D shapes of 128K buildings along with some 175K trees, build the user interface, and finally debug.
All models delivered a functional result from a single prompt, including the smaller models, except for a minor bug with GPT-6 Luna, which was fixed in a simple follow-up prompt.
The quality is excellent across the board. In the pre-AI era, this would have required at least 3 skilled humans: a data analyst, a front-end developer, and a designer or data viz expert. It would have taken weeks, and I bet the result would have generated significant buzz, if not awards.
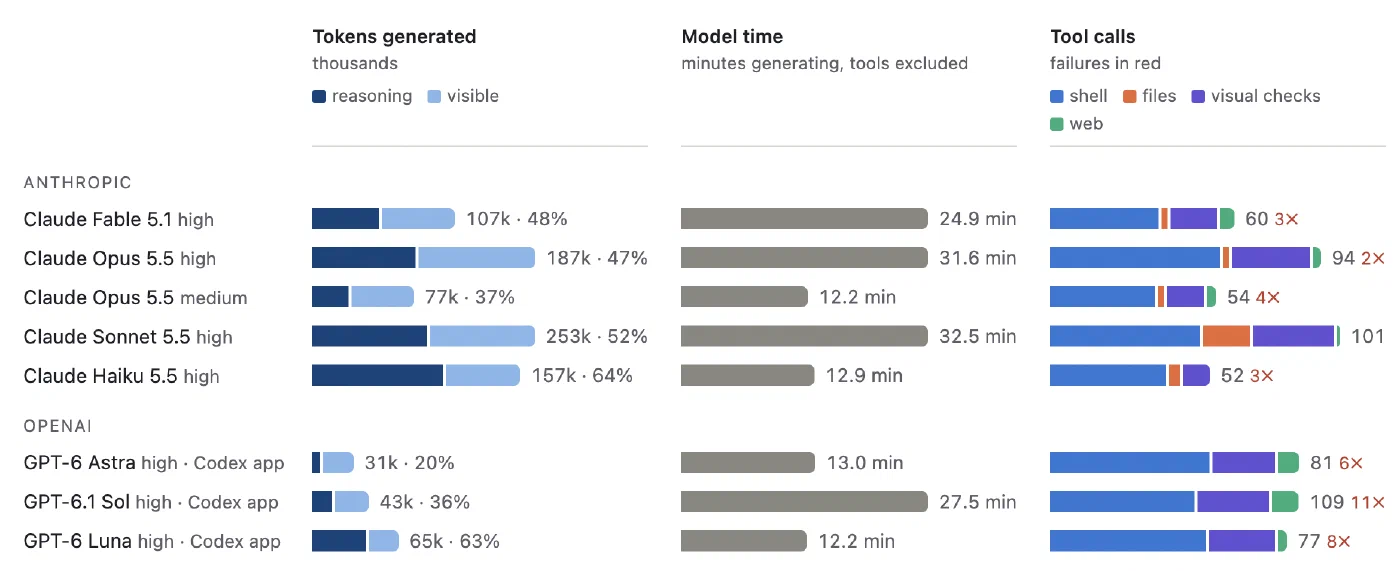
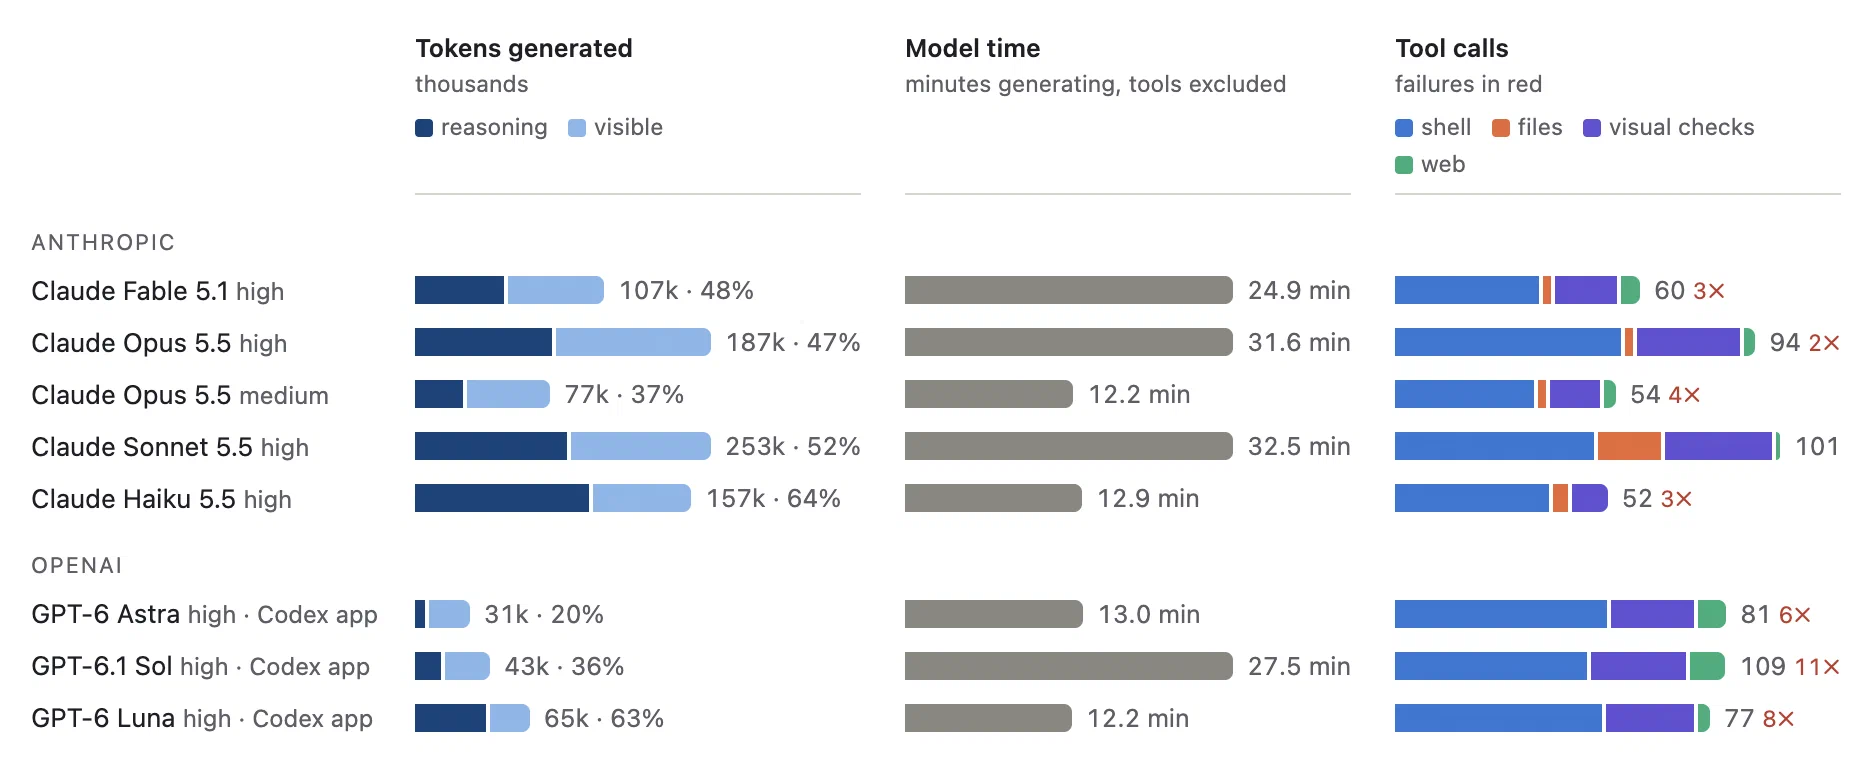
The degree of autonomy with the right harness (Claude Code and Codex) is remarkable to watch: some models worked for 30 minutes, with around 100 tool calls, including dozens of visual checks in a headless browser, to debug the interface.
Measuring output tokens shows that larger models use fewer reasoning tokens than their smaller counterparts, because they are more skilled and reach a better result faster.
My personal favorite result is from Opus 5.5 high, for its great color choices, smooth timeline animation, and relatively fluid 3D interface. I prefer it over Fable and Astra, which won't surprise anyone who has followed the vibe about this model on X lately. Opus 5.5 is currently my daily workhorse for coding. I only prefer Fable for tasks that require taste, typically writing and UI.
Here's the full prompt, if you want to test it yourself:
Build an interactive 3D map of Paris that shows every building in the city in volume, colored by its construction period.
The goal is an exceptional visual result, as beautiful and impressive as possible: a piece worthy of a great atlas, not a mere technical demo.
Expected result:

* Every building rises to its real height and is colored by its construction period.
* A legend lists each period with its share of the building stock. Clicking a period highlights it.
* A slider lets the viewer travel back in time, year by year, starting from 1800.
* The Seine, the canals and the parks are shown to give the city context.
* Trees can be shown or hidden.
* The map covers inner Paris (intra-muros), excluding the Bois de Boulogne and the Bois de Vincennes.

Available data sources (ODbL license):

* Apur, "Emprise bâtie Paris" (construction period, year and height of each building): https://carto2.apur.org/apur/rest/services/OPENDATA/EMPRISE_BATIE_PARIS/MapServer/0
* Paris Open Data, "Arrondissements" (district boundaries): https://opendata.paris.fr/explore/dataset/arrondissements
* Paris Open Data, "Plan de voirie – Voies d'eau" (waterways): https://opendata.paris.fr/explore/dataset/plan-de-voirie-voies-deau
* Paris Open Data, "Espaces verts et assimilés" (green spaces): https://opendata.paris.fr/explore/dataset/espaces_verts
* Paris Open Data, "Les arbres" (trees): https://opendata.paris.fr/explore/dataset/les-arbres