#Performance metrics of ML models
---
date:
· theme: data
· words: 477
---
For classification models
- Confusion matrix: not a metric per se, but a tabular summary that is commonly used to evaluate the performance of a classification model. It provides a breakdown of the model's predictions versus the actual ground truth labels.
| Predicted 0 | Predicted 1 | |
|---|---|---|
| Actual 0 | True Negatives | False Positives |
| Actual 1 | False Negatives | True Positives |
- Accuracy: simplest metric, measures the fraction of correct predictions made by the model over the total number of predictions.
- Precision: measures the fraction of true positive predictions out of all positive predictions made by the model. It addresses the question: "Of all the instances predicted as positive, how many were actually positive?"
- Recall: measures the fraction of true positive predictions out of all actual positive instances. It answers: "Of all the actual positive instances, how many were correctly predicted as positive?"
- F1-score: harmonic mean of precision and recall, the F1-score combines them into a single metric for better interpretation. Useful when you want to balance the trade-off between precision and recall, and when both of these metrics are equally important for your problem. Also, it is appropriate for imbalanced datasets.
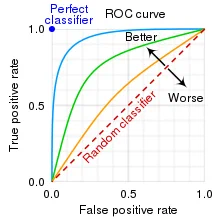
- Area Under the ROC Curve (AUC-ROC): For binary classification problems, the ROC curve plots the true positive rate against the false positive rate at various classification thresholds. The AUC-ROC measures the area under this curve, with a higher value indicating better performance.
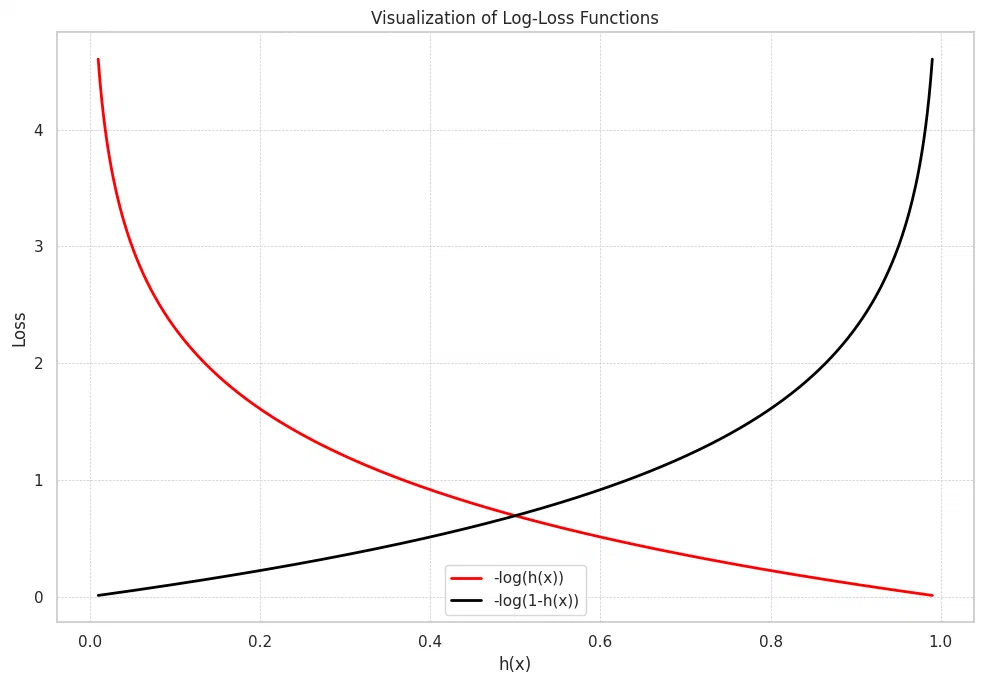
- Log Loss (Cross-Entropy Loss): A probabilistic metric that measures the performance of a classification model whose output is a probability value between 0 and 1. It penalizes confident and incorrect predictions.
For regression models
- Mean Squared Error (MSE): measures the average squared difference between the predicted values and the actual values.
- Root Mean Squared Error (RMSE): Square Root of the MSE, easier to interpret since it’s the same order of magnitude than the dependent variable.
- Mean Absolute Error (MAE): measures the average absolute difference between the predicted values and the actual values. MAE is less sensitive to outliers compared to RMSE because it does not square the errors.
- R-squared (R²): measures the proportion of variance in the target variable (TSS, aka Total Sum of Squares) that is explained by the independent variables in the model (RSS, aka Residuals Sum of Squares).