#Meteorite landings mapped in R
Project
NASA publishes a list of all known meteorite landings, compiled by the Meteoritical Society and available on Kaggle: 45,716 meteorites, each with its name, class, mass, the year it fell or was found, and its coordinates. The question I had in mind was simple: where do meteorites land?
The answer turned out to be a different one: the map does not show where meteorites fall, but where people find them. Meteorites fall evenly over the planet, mostly into the oceans, but they are only recorded when someone picks them up. The dataset says so itself, with a fall column: only about a thousand meteorites were seen falling, all the others were found later, sometimes thousands of years after landing.
Results
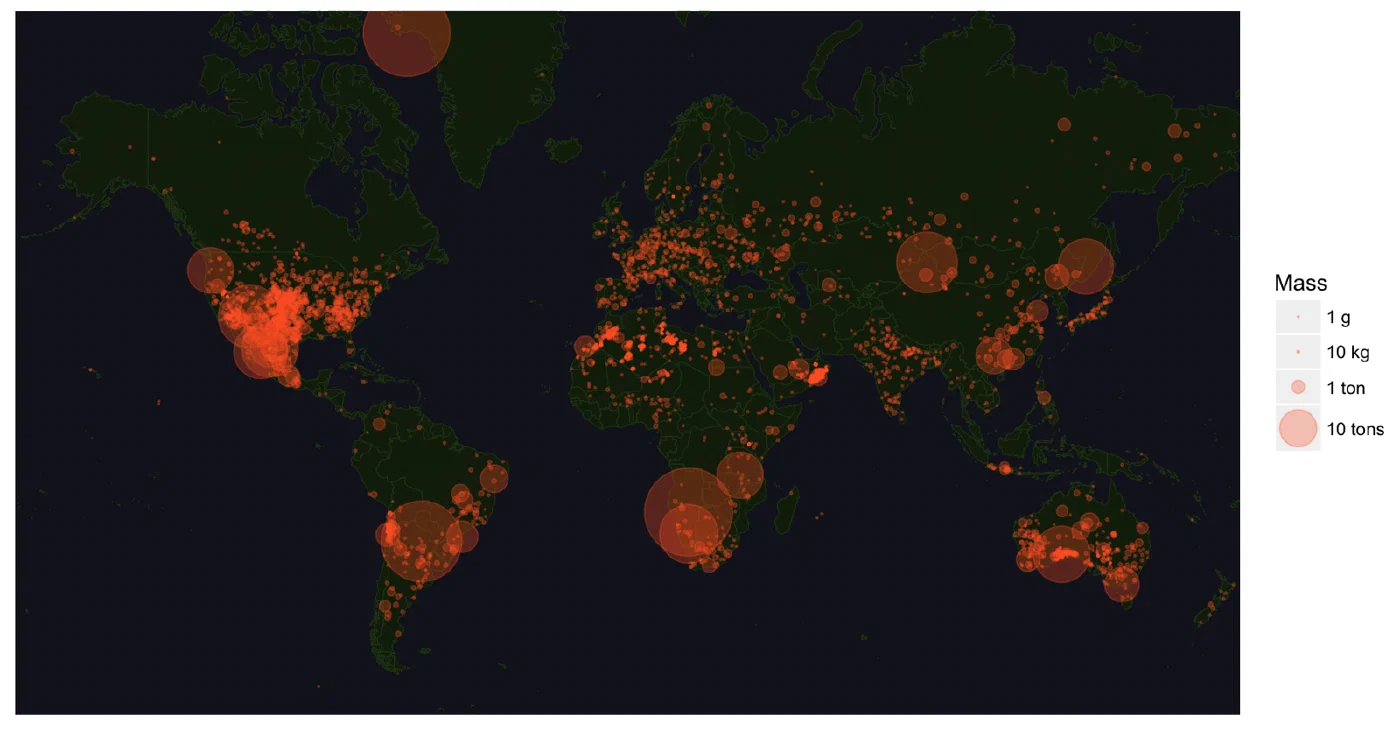
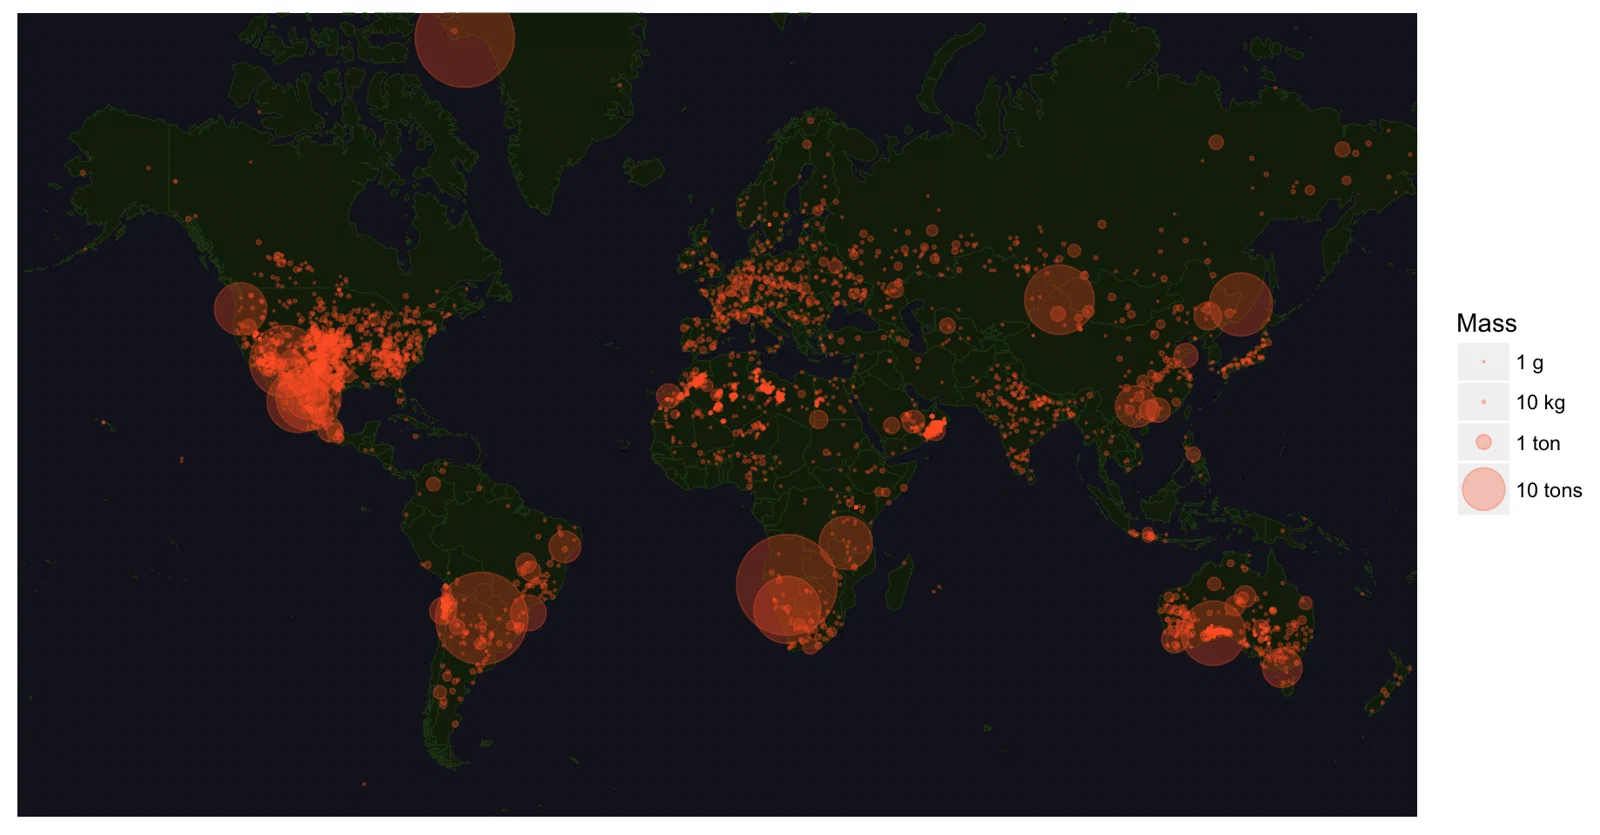
The dots gather where meteorites are easy to spot, and where people look for them:
- Deserts, where a dark stone stands out on light ground and erodes slowly: the Sahara, Oman, the Atacama, the Australian outback.
- Farmland in densely surveyed countries: the Great Plains of the United States, Western Europe, Japan.
- Antarctica, which I cut from the map so as not to crush the rest of the world, is in fact where most meteorites are found: the ice carries them and concentrates them in a few places, where expeditions collect them every year.
The largest circles are the famous giants: Hoba in Namibia, about 60 tons and never moved from where it lies; Cape York in Greenland; Campo del Cielo in Argentina; and in North America, Willamette in Oregon and Chupaderos in Mexico.
The United States show the effect of the search, rather than of the sky, even more clearly:
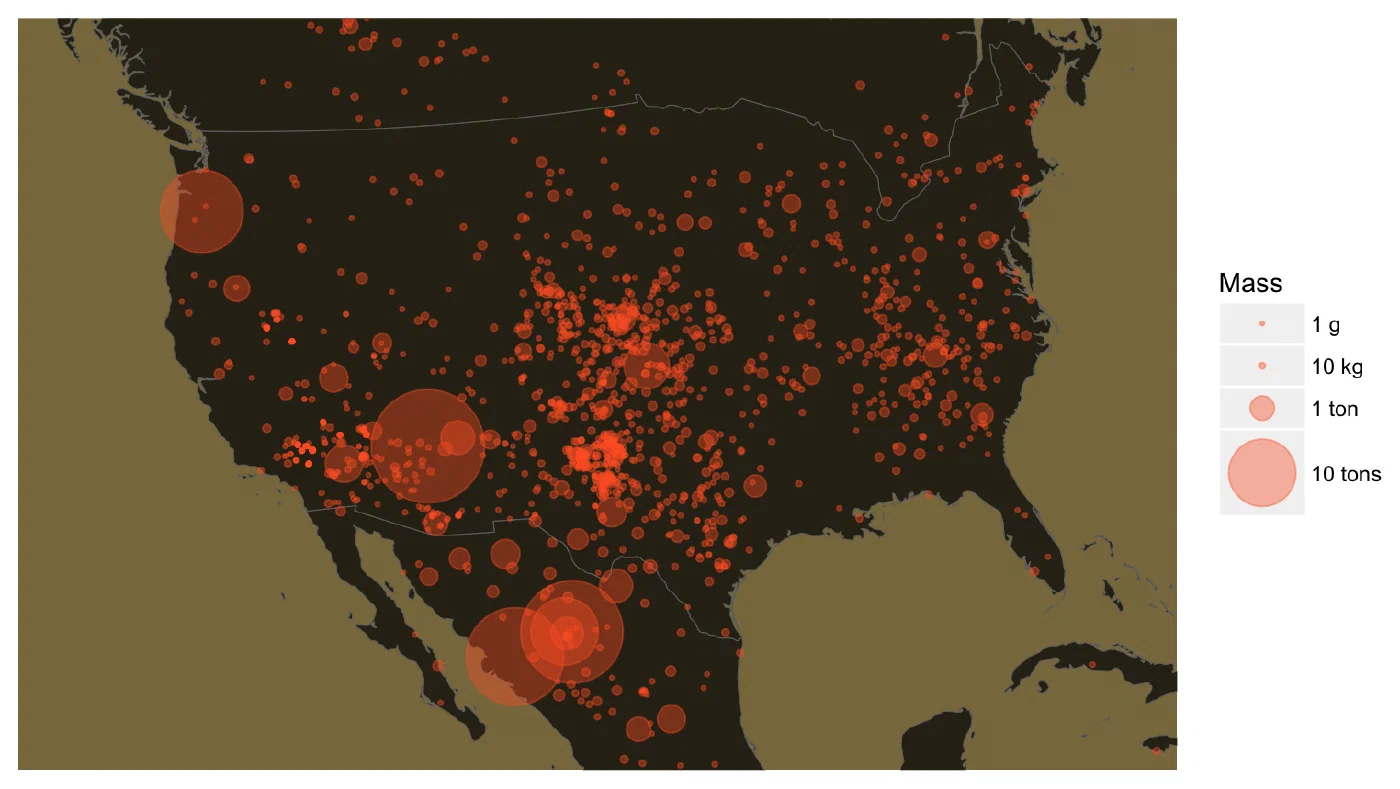
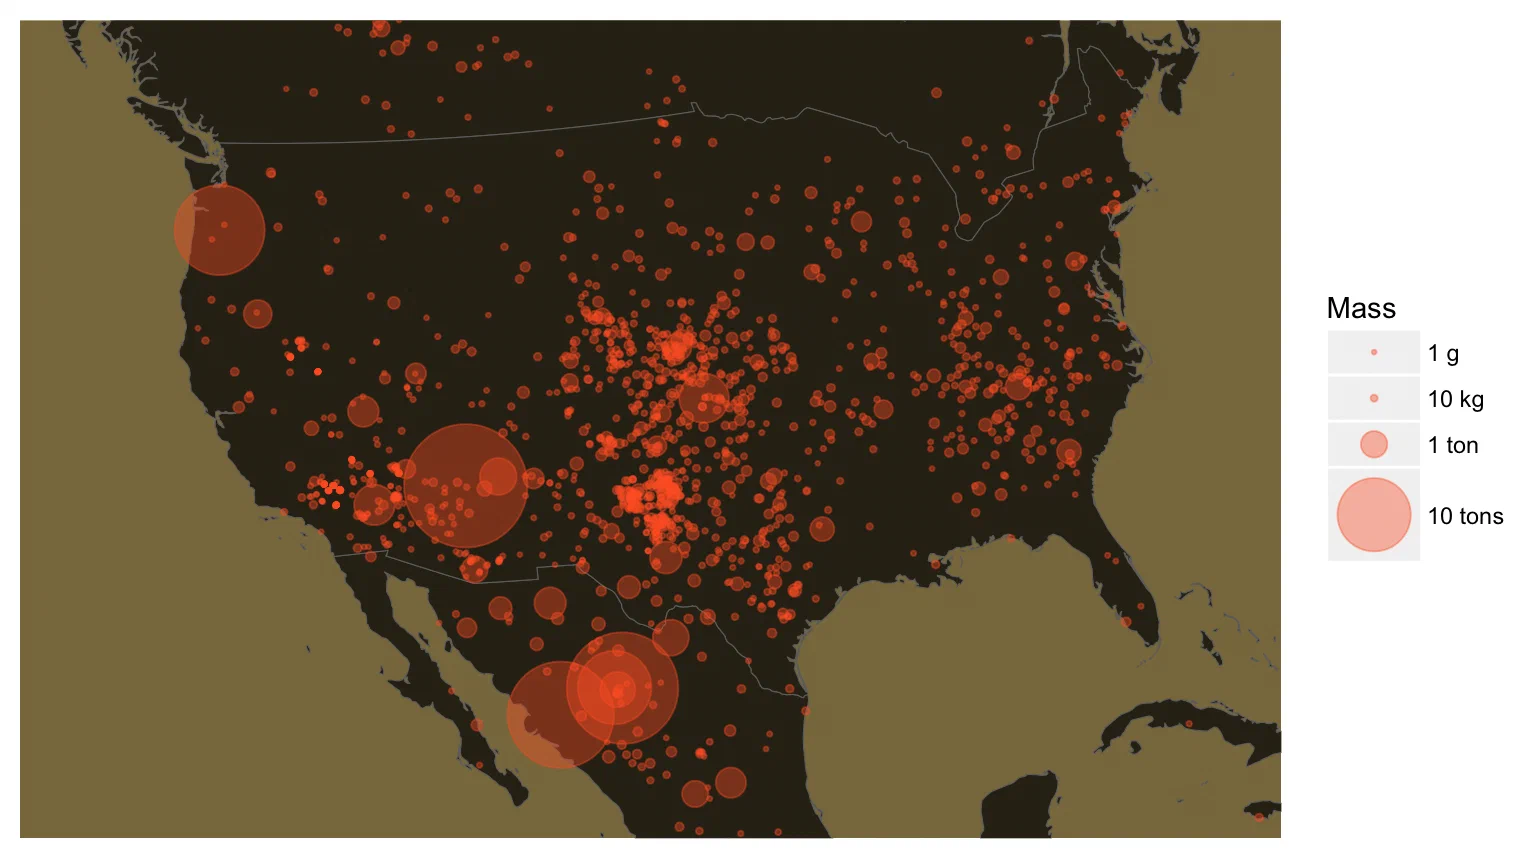
The Great Plains, from Texas to Nebraska, hold far more meteorites than the rest of the country. That's where farmers ploughing their fields kept turning up heavy stones, and where collectors went looking for them, while the forests of the East and the mountains of the West hide theirs.
Full Code
Data loading and cleaning
# Load libraries
library('dplyr')
library('maps')
library('ggplot2')
library('readr')

# Load data
fulldata <- read_csv('./meteorite-landings.csv')

# Keep valid years, valid coordinates, and known masses
cleandata <-
    fulldata %>%
    filter(year >= 860 & year <= 2016) %>%
    filter(reclong <= 180 & reclong >= -180
           & (reclat != 0 | reclong != 0)) %>%
    filter(!is.na(mass))
Some meteorites have coordinates at (0, 0), in the Gulf of Guinea: those are missing values, not landings at sea.
World map
world_map <- map_data("world")

theme_map <-
    theme(
        panel.background = element_rect(fill = "#161823", colour = NULL),
        panel.grid = element_blank(),
        axis.text = element_blank(),
        axis.title = element_blank(),
        axis.ticks = element_blank(),
        legend.text = element_text(size = rel(0.8))
    )

ggplot() +
    geom_map(map = world_map, fill = "#15250C",
             color = "#264216", size = 0.2,
             aes(map_id = world_map$region)) +
    coord_map(projection = "mercator", xlim = c(-180, 180), ylim = c(90, -62)) +
    expand_limits(x = world_map$long + 1, y = world_map$lat + 1) +
    geom_point(data = cleandata, colour = "#FE642E", alpha = 0.3,
               aes(x = reclong, y = reclat, size = mass)) +
    theme_map +
    labs(x = "", y = "") +
    scale_size_continuous(name = "Mass", breaks = c(0, 1e4, 1e6, 10e6),
                          labels = c("1 g", "10 kg", "1 ton", "10 tons"),
range = c(0.1, 20))United States
The same map, with an orthographic projection centred on North America, which avoids the distortion of Mercator at these latitudes:
theme_map <-
    theme(
        panel.background = element_rect(fill = "#89784C", colour = NULL),
        panel.grid = element_blank(),
        axis.text = element_blank(),
        axis.title = element_blank(),
        axis.ticks = element_blank(),
        legend.text = element_text(size = rel(0.8))
    )

ggplot() +
    geom_map(map = world_map, fill = "#302A1A",
             color = "#6E6E6E", size = 0.2,
             aes(map_id = world_map$region)) +
    coord_map(projection = "ortho", orientation = c(20, -120, 0),
              xlim = c(-130, -75), ylim = c(22, 50)) +
    expand_limits(x = world_map$long + 1, y = world_map$lat + 1) +
    geom_point(data = cleandata, colour = "#FE642E", alpha = 0.4,
               aes(x = reclong, y = reclat, size = mass)) +
    theme_map +
    labs(x = "", y = "") +
    scale_size_continuous(name = "Mass", breaks = c(0, 1e4, 1e6, 10e6),
                          labels = c("1 g", "10 kg", "1 ton", "10 tons"),
                          range = c(0.5, 30))