#Building a navigable 3D Paris with public transit
With Fable 5.2, my previous benchmark (the 3D atlas of Paris) has become too easy. Models now have to be tested on much more ambitious builds. So this time, I asked Fable to create a real navigable Paris, almost like a small video game, and to make it useful: you can see the city's transit moving around at the current time, as scheduled.
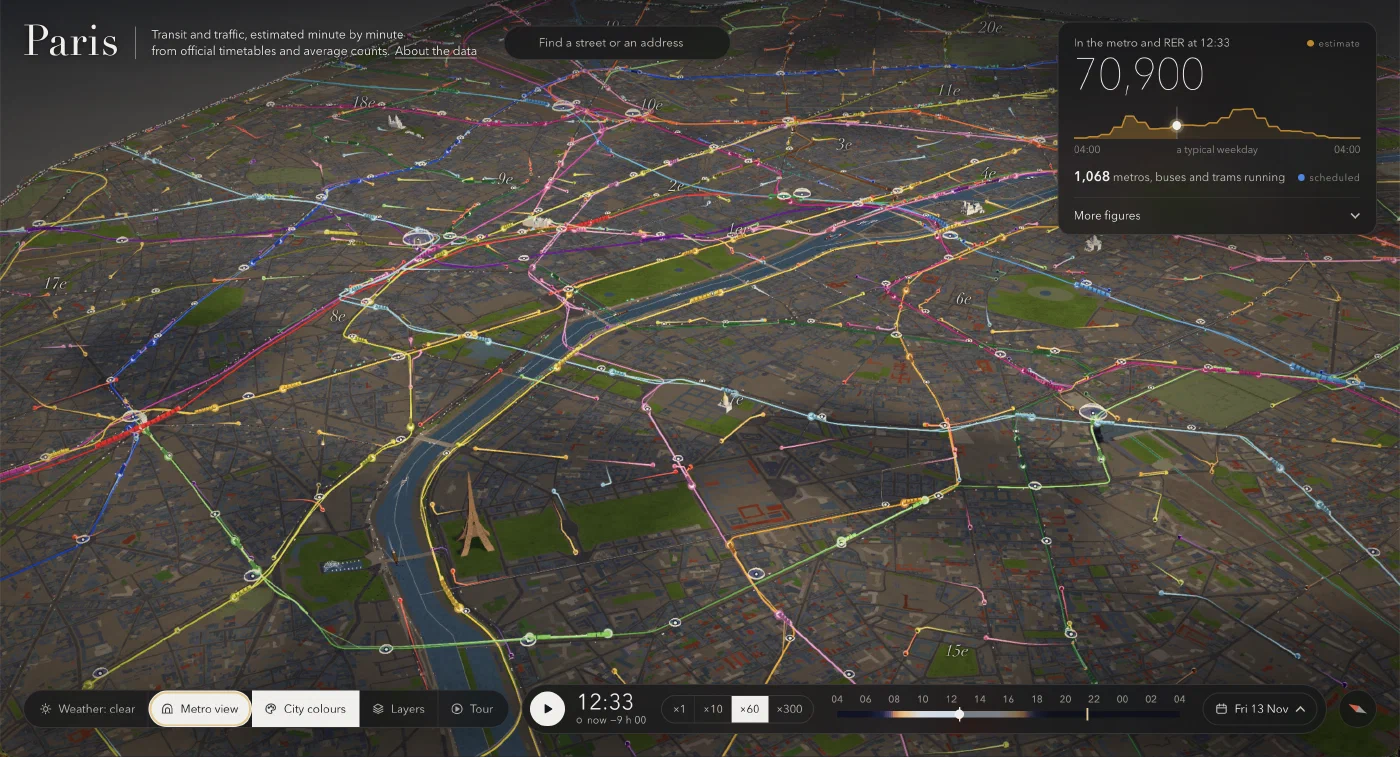
So I built a 3D model of Paris intra-muros, leveraging open data:
- the 125K buildings at their real height, the terrain, the Seine, the trees
- metros, RER, suburban trains, trams and buses, each on its route and on its schedule
- road traffic and bikes, based on the city's counts
- a "metro view" that erases the city to leave only the underground network
- day and night computed for the real date and time, with four weather options
- a search by street or address, and a one-minute guided tour
This time I didn't get there on the first try. The first prompt gave an impressive v1, but I spent a few hours on follow-up changes to make it truly immersive. Getting the transit lights and colors right was one of the challenges. For a broad improvement of the finer details, I adapted one of Simon Willison's tricks to: "make it MUCH more detailed". It worked surprisingly well.
🗺️ Explore this small universe here: lassence.net/projects/paris-transit
The numbers
It was not a single-prompt project, and it ate up a significant part of my weekly quota, but I think it was worth it. Here are a few numbers to give you an idea:
- v1: one prompt, then Fable 5.2 worked alone for 1h39, with 162 tool calls and 364K tokens generated.
- The rest: 78 follow-up prompts spanned over two days, for about 11 hours of agent work.
- 9 agents: the v1 run, the main Fable session, one Fable sub-agent for the interface, and six Opus 5.5 sub-agents for building the rest of the features. I eventually dropped two features (sound and riding a train).
- Code: 7.5K lines of Python and JavaScript.
Traffic and transit on screen are estimates (vehicles follow the planned timetable, traffic follows average counts) from these main open data sources:
- Île-de-France Mobilités: timetables (48K runs on a weekday) and ticket validations at 260 stations
- Apur: 125K buildings with their height
- Paris Open Data: road counts on 1.7K segments, bike counters, 175K trees
The brief
In the end, all you need is to ask Fable to write the complete brief of what we just built as a markdown file, so you can reproduce it next time with another model.
### What we are building

A web page showing inner Paris in 3D, with its metros, RER, trains, trams, buses and road traffic moving, at the current time in Paris when the page is opened. The visitor arrives, sees the city alive, and wants to explore: circle the Eiffel Tower, follow a train, switch to night, watch the rush hour.

The audience is a curious visitor arriving from a link, with no explanation, on a computer or a phone. They must understand within five seconds what they are looking at.

The visual tone: a carefully made architect's model, lit by a real sun. It is the real Paris, not a video-game or fantasy world. Flat, neutral ground around the city (no floating island), no depth-of-field blur, no sound.

Transit is the subject. The city is the backdrop: beautiful but discreet (stone and grey tones), so that the vehicles and lines, in bright colours, stand out.

### Technical constraints

- Static page: `index.html`, CSS, ES modules, three.js bundled in `vendor/`. No build step, no framework, no application server. It must run behind a plain `python3 -m http.server`.
- No API key, no paid service. The only network call at runtime: address search (the public IGN geocoder, `data.geopf.fr/geocodage/search`, restricted to Paris).
- Data is prepared in advance by Python scripts run with `uv run` (dependencies declared in the scripts), which write compact, compressed binary files into `web/data/` (about 60 MB in total). A single command (`sh pipeline/build.sh`) downloads, builds and checks. Data is not versioned.
- Interface and text in English.
- Smooth on a recent laptop (60 frames per second in the overview) and usable on a phone. Quality adapts by itself if the machine struggles (resolution, then anti-aliasing).

### Data, all open

- **Buildings**: Apur, "Emprise bâtie Paris" (footprints, heights, ground altitude), about 125,000 buildings.
- **Timetables**: GTFS from Île-de-France Mobilités, plus the rail network layout and the list of stations.
- **Ridership**: IDFM validations per station, hourly profiles by type of day.
- **City of Paris** (opendata.paris.fr): arrondissements, waterways, green spaces, roadways, rail land, trees (about 175,000), hourly road counts and their geographic reference, bike counts.

Scope: Paris without its two woods. Three types of day: weekday, Saturday, Sunday.

### The city

- Buildings extruded to their real height, set on the real terrain (Montmartre and Belleville show), with two levels of detail. Up close: windows, roofs, facades; at night, lit windows.
- The Seine dug into the terrain, with reflections, bridges in light stone, sightseeing boats.
- Parks in green, individual trees, roadways, rail yards.
- A few monuments redrawn by hand, where the raw footprint is not enough: the Eiffel Tower (readable lattice, not too thin; golden lighting in tiers at night; sparkling small white dots for five minutes every hour on the hour, visible from far and near; rotating beacon), the Louvre pyramid, the Invalides dome, the Arc de Triomphe, the Sacré-Cœur, Notre-Dame, the Panthéon, the Concorde obelisk, the July Column, the Trocadéro fountains, the André-Citroën park balloon. Faithful proportions: check them.
- Sky, sun and shadows computed for the real date and time in Paris. Dawn, dusk and night done with care: at night the streets light up and the city becomes a map of lights.
- Four weathers to choose from: clear, rain, mist, snow.

### Transit, the main subject

- **Vehicles**: each GTFS run is a vehicle following its route on schedule. Multi-car trains for metro, RER and suburban trains; buses and trams at their scale. Real small 3D volumes, in the official colour of their line, with a glowing trail that helps spot them from afar.
- **Lines**: coloured ribbons along the tracks. Underground sections are drawn below the city and fade as you get close to the ground, so they do not cross out the streets.
- **Stations**: a glass dome whose size follows the number of entries at that hour, with the official symbol of the mode (M, RER, train, tram). These symbols must be exact.
- **Road traffic**: small cars running on the counted roads, in numbers proportional to that hour's count. Bikes at the counters.
- **Metro view**: a button that fades the city to show only the network and the trains, underground included.
- Click on a vehicle, a line or a station: a short card (line, direction, next stop, ridership).

These are estimates: theoretical timetables and average counts, not live positions. The page says so once, simply, in its subtitle and in an "About" panel. No repeated warnings elsewhere.

### Time

- The page opens at the real time in Paris, playing at ×60 speed.
- A time bar at the bottom: play/pause, time, speeds (×1, ×60, ×600; ×1 must be exactly real time), a button to go back to "now", choice of day. Collapsed by default; expanded, it shows over 24 hours the curves of vehicles in service, station entries, road traffic and bikes, with the day/night band, and you slide along it to change the time.

### The interface

Discreet, immersive, readable. On arrival, almost nothing on screen; panels open on demand. Every word and every button must be useful and understood without explanation.

- **Entry**: after loading, the camera is already on the home view (looking down from the south-west, Eiffel Tower in the foreground, the city behind) and the title "Paris transit, right now" shows large for a second or two, with a one-line subtitle, then fades.
- **Top**: the name, a street or address search with autocomplete, and a live figure given prominence: the estimated number of people in the metro and RER at that time, expandable into a few other figures.
- **Bottom**: a group of view buttons (weather, Metro view, City colours, Layers, Tour), the time bar, a compass that puts north back on top.
- **City colours**: a smooth switch between the city in neutral tones (default) and the city in colour.
- **Tour**: an automatic visit of a little over a minute, in eight shots with a short caption each: first trains before dawn, morning rush at Gare du Nord, line 6 on the Bir-Hakeim bridge, Metro view, boats on the Seine, nightfall, the Eiffel Tower sparkling, back to the home view. Figures in the captions are computed from the data.
- **Phone**: a dedicated layout under 720 px wide (icon buttons, time bar on one line, panels that fit the screen). The page can be shown in a frame (iframe).
- URL parameters to share or capture a view: time, day, camera, weather, playback, etc.

### What not to do

- No fantasy world, no floating island, no gratuitous video-game effects.
- No sound, no "ride the train" mode, no focus blur.
- No stray squares or dots: every light element must be identifiable.
- No long text on screen, no jargon.

### Expected deliverable

- `web/` (the page), `pipeline/` (the scripts and a README: sources with their addresses, steps, what goes stale and how to update it), a short `README.md`.
- Before handing over: build the data, open the page in a headless browser and check with screenshots the home view by day and by night, a close-up of a station and a train, the Metro view, the phone layout, and the absence of console errors. Check that the number of vehicles shown at 8:30 on a weekday is plausible (around 1,400 to 1,500) and that the trains do run on their tracks.
- Say clearly what you could not check.