With Google Analytics 360, you can access raw logs stored on BigQuery, with detail at hit level. This allows for much more thorough and finer analyses. Here are some examples of audience insights that can be generated with SQL queries only.
# Launch BigQuery client from the JSON credentials filebq_client=bigquery.Client.from_service_account_json('../../bigquery_creds.json')# Helper function for queries to be returned as a Dataframedefbquery(sql):returnbq_client.query(sql).to_dataframe()
# Sessions and page views for 10 dayssql="""
SELECT
PARSE_DATE("%Y%m%d", date) AS date,
COUNT(DISTINCT fullVisitorId) AS visitors,
SUM(totals.visits) AS sessions,
SUM(totals.pageviews) AS pageviews,
FROM `bigquery-public-data.google_analytics_sample.ga_sessions_*`
WHERE
_TABLE_SUFFIX BETWEEN '20170701' AND '20170710'
GROUP BY 1
ORDER BY 1
"""bquery(sql)
# Traffic KPIs broken down by device and acquisition channelsql="""
SELECT
device.deviceCategory AS device,
channelGrouping AS channel_grouping,
SUM(totals.visits) AS sessions,
SUM(totals.pageviews) AS pageviews
FROM `bigquery-public-data.google_analytics_sample.ga_sessions_*`
WHERE
_TABLE_SUFFIX BETWEEN '20170701' AND '20170710'
GROUP BY 1,2
ORDER BY 1,2
"""bquery(sql)
# Pages per session, average sessions duration (in seconds) and bounce ratesql="""
SELECT
PARSE_DATE("%Y%m%d", date) AS date,
SUM(totals.visits) AS sessions,
SUM(totals.pageviews)/SUM(totals.visits) AS page_per_session,
SUM(totals.timeOnSite)/SUM(totals.visits) AS avg_session_duration,
SUM(totals.bounces)/SUM(totals.visits) AS bounce_rate
FROM `bigquery-public-data.google_analytics_sample.ga_sessions_*`
WHERE
_TABLE_SUFFIX BETWEEN '20170701' AND '20170710'
GROUP BY 1
ORDER BY 1
"""bquery(sql)
# Transactions and revenuesql="""
SELECT
PARSE_DATE("%Y%m%d", date) AS date,
SUM(totals.visits) AS sessions,
SUM(totals.transactions) AS transactions,
SUM(totals.transactions)/SUM(totals.visits) AS conversion_rate,
SUM(totals.transactionRevenue)/1e6 AS revenue,
SUM(totals.transactionRevenue)/1e6/SUM(totals.transactions) AS avg_purchase_value
FROM `bigquery-public-data.google_analytics_sample.ga_sessions_*`
WHERE
_TABLE_SUFFIX BETWEEN '20170701' AND '20170710'
GROUP BY 1
ORDER BY 1
"""bquery(sql)
Several types of Goals can be defined in Google Analytics:
Destination page: e.g. /registersuccess.html
Duration: e.g. mininum 5 minutes per session
Pages per session: e.g. >10 pages per session
Event: e.g. click on a video
Goals are not computed in BigQuery raw logs, they have to be extracted with a query. Unlike queries above, that made use of the pre-aggregated metrics in the totals field, we now need to unnest the hits nested field to extract pages paths, so we compute sessions differently, by counting the number of distinct sessions IDs.
# Compute if a goal has been reached in each sessionsql="""
WITH sub1 AS (
SELECT
PARSE_DATE("%Y%m%d", date) AS date,
CONCAT(fullVisitorId, CAST(visitId AS STRING)) AS session_id,
-- Goal: browsed to page /registersuccess.html
MAX(IF(hits.page.pagePath = '/registersuccess.html', 1, 0)) AS goal_destination,
-- Goal: session duration >= 5 min
MAX(IF(totals.timeOnSite >= 300, 1, 0)) AS goal_duration,
-- Goal: pages per session > 10
MAX(IF(totals.pageviews > 10, 1, 0)) AS goal_pageviews
FROM
`bigquery-public-data.google_analytics_sample.ga_sessions_*`,
UNNEST(hits) AS hits
WHERE
_TABLE_SUFFIX BETWEEN '20170701' AND '20170710'
AND totals.visits > 0
GROUP BY date, session_id
)
SELECT
date,
COUNT(session_id) AS sessions,
SUM(goal_destination) AS goals_destination,
SUM(goal_duration) AS goals_duration,
SUM(goal_pageviews) AS goals_pageviews
FROM sub1
GROUP BY date
ORDER BY date
"""bquery(sql)
date
sessions
goals_destination
goals_duration
goals_pageviews
0
2017-07-01
2048
30
181
114
1
2017-07-02
1895
32
168
104
2
2017-07-03
2046
39
214
116
3
2017-07-04
1938
31
194
94
4
2017-07-05
2885
53
312
202
5
2017-07-06
2658
43
280
156
6
2017-07-07
2450
55
298
195
7
2017-07-08
1859
34
208
114
8
2017-07-09
1921
39
186
129
9
2017-07-10
2769
72
338
220
##Path length: how many sessions before converting
# Get number of session before a transaction, and conversion rates by session positionsql="""
WITH sub1 AS (
SELECT
fullVisitorId,
CONCAT(fullVisitorId, CAST(visitId AS STRING)) AS session_id,
visitStartTime,
MAX(IF(totals.transactions > 0, 1, 0)) AS transaction_session,
RANK() OVER (PARTITION BY fullVisitorId ORDER BY visitStartTime) AS session_number
FROM `bigquery-public-data.google_analytics_sample.ga_sessions_*`
WHERE
_TABLE_SUFFIX BETWEEN '20170701' AND '20170710'
GROUP BY fullVisitorId, session_id, visitStartTime
)
SELECT
session_number,
COUNT(session_id) AS sessions,
SUM(transaction_session) AS transactions,
SUM(transaction_session)/COUNT(session_id) AS conversion_rate
FROM sub1
GROUP BY session_number
HAVING transactions > 0
ORDER BY session_number
"""bquery(sql)
# Get time lag (in days) between first session of a user and a converting sessionsql="""
WITH sub1 AS (
SELECT
fullVisitorId,
MIN(visitStartTime) OVER (PARTITION BY fullVisitorId ORDER BY visitStartTime) AS first_session_time,
MAX(IF(totals.transactions > 0, visitStartTime, 0)) AS transaction_session_time
FROM `bigquery-public-data.google_analytics_sample.ga_sessions_*`
WHERE
_TABLE_SUFFIX BETWEEN '20170701' AND '20170710'
GROUP BY fullVisitorId, visitStartTime
)
SELECT
FLOOR((transaction_session_time - first_session_time)/3600/24) AS lag_days,
COUNT(*) AS transactions
FROM sub1
WHERE transaction_session_time > 0
GROUP BY lag_days
ORDER BY lag_days
"""bquery(sql)
# Differentiate between SEA keywords containing 'google' vs otherssql="""
SELECT
CASE
WHEN REGEXP_CONTAINS(LOWER(trafficSource.keyword), r"google") AND channelGrouping = 'Paid Search' THEN 'Paid Search Brand'
WHEN channelGrouping = 'Paid Search' THEN 'Paid Search Non Brand'
ELSE 'Other channels'
END AS channel,
SUM(totals.visits) AS sessions,
SUM(totals.transactions) AS transactions,
SUM(totals.transactions)/SUM(totals.visits) AS conversion_rate,
FROM `bigquery-public-data.google_analytics_sample.ga_sessions_*`
WHERE
_TABLE_SUFFIX BETWEEN '20170701' AND '20170710'
GROUP BY 1
ORDER BY 1
"""bquery(sql)
Definition of “Direct” channel in Google Analytics is rather narrow. A user will only be considered coming through “Direct” if he/she did not previously came via any other channel. Hence, acquisition channels in GA are attributed to the Last Non-Direct click.
With the BigQuery raw data, you can know if a user actually came directly to your site, even if he/she previously arrived via another channel, with the trafficSource.isTrueDirect field. Note how conversion rates are much higher when considering this parameter.
# Differentiate True Direct in channelssql="""
SELECT
channelGrouping AS channel,
trafficSource.isTrueDirect IS NOT NULL AS true_direct,
SUM(totals.visits) AS sessions,
SUM(totals.transactions) AS transactions,
ROUND(100*SUM(totals.transactions)/SUM(totals.visits), 2) AS conversion_rate,
FROM `bigquery-public-data.google_analytics_sample.ga_sessions_*`
WHERE
_TABLE_SUFFIX BETWEEN '20170701' AND '20170731'
GROUP BY 1,2
ORDER BY 1,2
"""bquery(sql)
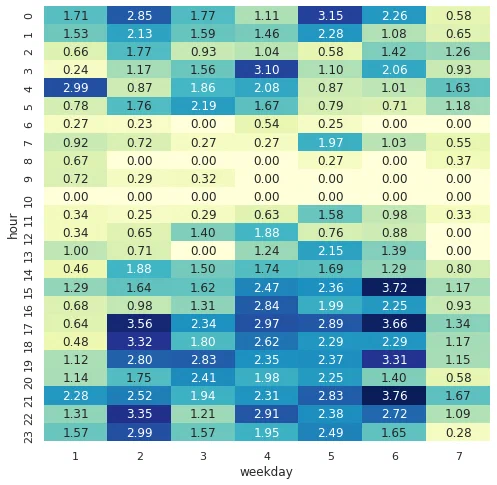
# Conversion rate by weekday and hoursql="""
SELECT
EXTRACT(DAYOFWEEK FROM PARSE_DATE("%Y%m%d", date)) AS weekday,
EXTRACT(HOUR FROM PARSE_TIMESTAMP("%s", CAST(visitStartTime AS STRING))) AS hour,
100*SUM(totals.transactions)/SUM(totals.visits) AS conv_rate
FROM `bigquery-public-data.google_analytics_sample.ga_sessions_*`
WHERE
_TABLE_SUFFIX BETWEEN '20170701' AND '20170731'
GROUP BY 1,2
"""slots=bquery(sql)# Plot as a heatmapfig,ax=plt.subplots(1,1,figsize=(8,8))sns.heatmap(slots.pivot(index='hour',columns='weekday',values='conv_rate').fillna(0),cmap="YlGnBu",annot=True,fmt='.2f',cbar=False);
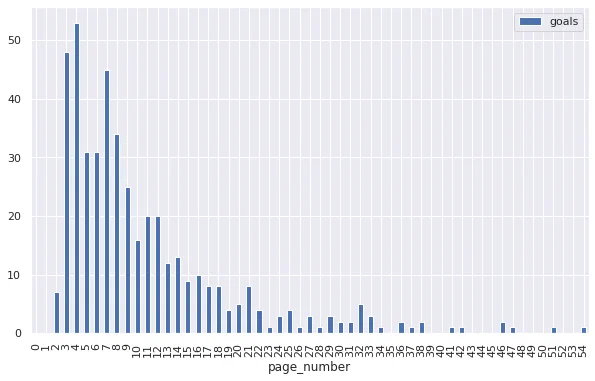
##How many pageviews before reaching a Destination Goal
# Number of pages viewed in a session before reaching a Goal (destination page)sql="""
WITH sub1 AS (
SELECT
CONCAT(fullVisitorId, CAST(visitId AS STRING)) AS session_id,
-- Window function to compute rank of each Page viewed in a session
RANK() OVER (PARTITION BY fullVisitorId, visitId ORDER BY hits.hitNumber) AS page_number,
hits.page.pagePath AS page
FROM `bigquery-public-data.google_analytics_sample.ga_sessions_*`,
UNNEST(hits) AS hits
WHERE
_TABLE_SUFFIX BETWEEN '20170701' AND '20170710'
-- Filter on Pages only, we don't want all Hits types
AND hits.type = 'PAGE'
GROUP BY fullVisitorId, visitId, hits.hitNumber, page
)
SELECT
page_number,
COUNT(*) AS goals
FROM sub1
-- Filter on the destination page associated with a Goal
WHERE page = '/registersuccess.html'
GROUP BY 1
ORDER BY 1
"""goals_pages=bquery(sql)# Plot distribution(goals_pages.set_index('page_number').reindex(list(range(0,max(goals_pages['page_number'])+1))).plot(kind='bar',figsize=(10,6)));