#Alpha-spending functions for sequential testing
What is sequential testing?
Standard frequentist tests (like z-tests) assume that data is analyzed all at once, when all data has been collected, a concept referred to as a “fixed horizon”. Peeking, or repeatedly analyzing data during collection, greatly inflates the false positive rate.
To compute intermediary results without this risk, one solution is sequential testing, which allows for data monitoring without inflating Type I error, while detecting early negative impacts on users.
The key principle is to define upper and lower boundaries for the test statistic based on a spending function. Beyond the Bonferroni correction (dividing alpha by the number of planned interim analyses), which is valid but very conservative, several spending functions exist, including Haybittle-Peto (1971, 1976), Pocock (1977), and O’Brien & Fleming (1979). These functions adjust the boundaries depending on the number of interim analyses.
However, they include strict requirements:
- The number of scheduled analyses must be determined prior to the onset of the trial.
- There must be equal spacing between scheduled analyses with respect to sample size accrual.
Below is a comparison of different methods. The O’Brien & Fleming is much more conservative in earlier steps, while the Pocock function is almost linear.
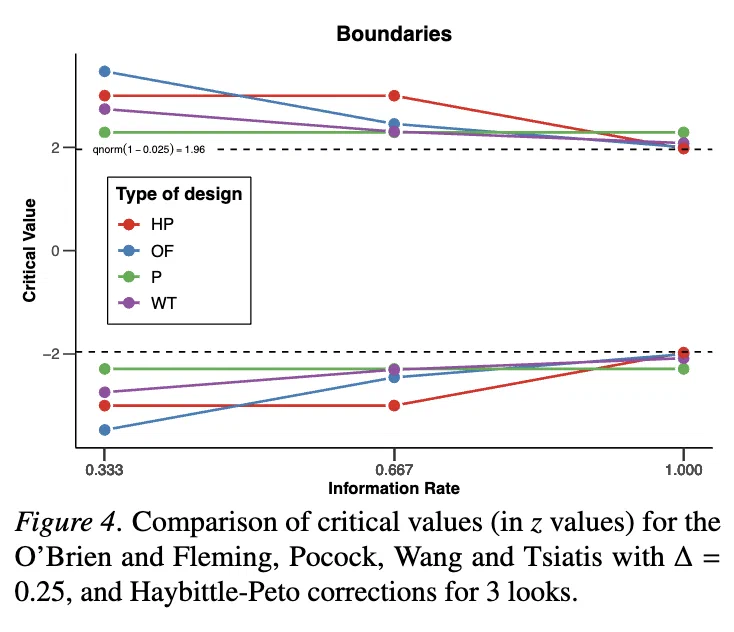
Alpha-spending functions
In 1983, Lan & DeMets developed an approach that removes these constraints, and depends instead on the fraction of information available at each checkpoint. This approach is known as an alpha-spending function.
They approximated the Pocock and O’Brien and Fleming boundaries with this method.
O’Brien and Fleming
Here’s the formula for O’Brien and Fleming approximation for a 1-sided case:
and for a 2-sided case:
Pocock
The Lan & DeMets approximation for Pocock boundaries is:
where is the fraction of information available at checkpoint.
Implementation in Python
Let’s implement in Python the Lan & DeMets approximation for O’Brien and Fleming boundaries.
- First we import sample data, that gives a daily cumulated number of users and converted users, for Control and Target groups:
# Import libraries
import pandas as pd
import numpy as np
import scipy.stats as st
import statsmodels.stats.proportion as smp
import matplotlib.pyplot as plt
import matplotlib.patches as pltp
import seaborn as sns
sns.set()

# Load sample data
df = pd.read_csv('gst_data.csv')
df.tail(10)
variant days users converted
44 control 23 985 572
45 target 23 1021 531
46 control 24 1040 604
47 target 24 1067 554
48 control 25 1063 617
49 target 25 1083 561
50 control 26 1092 632
51 target 26 1123 581
52 control 27 1119 647
53 target 27 1159 599- Then we implement the O’Brien and Fleming approximation function, that takes as parameters:
data_fraction: fraction of data at each checkpoint summed over all groups (must be between 0 and 1).alpha: the of the desired confidence levelsides: whether it’s a 1- or 2-sided test
The function will return boundaries for both the z-statistic and the alpha level.
# Lan and DeMets approximation for O'Brien and Fleming
def ld_of_bounds(data_fraction, alpha=0.05, sides=2):
    data_fraction = max(0, min(1, data_fraction))
    alpha_bound = sides * 2 * (1 - st.norm.cdf(st.norm.ppf(1 - (alpha / 2) / sides) / np.sqrt(data_fraction)))
    score_bound = st.norm.ppf(1 - alpha_bound / sides)
return score_bound, alpha_bound- We can also implement the Pocock function, with the same parameters:
# Lan and DeMets approximation for Pocock
def ld_pocock_bounds(data_fraction, alpha=0.05, sides=2):
    alpha_bound = (alpha / sides) * np.log(1+(np.exp(1)-1) * data_fraction)
    score_bound = st.norm.ppf(1 - alpha_bound / sides)
return score_bound, alpha_bound- Now for each checkpoint - every 2 days in this example - we run a Z-test for proportions, and the boundaries for data fraction at this point, i.e. the cumulated number of users over the pre-defined full sample size:
# Parameters
interim_days = np.arange(1, 28, 2)
full_sample_size = 1100

# Run test at each checkpoint
results_list = []
for i, n in enumerate(interim_days):

    control = df.loc[lambda x: (x['variant'] == 'control') & (x['days'] == n)]
    target = df.loc[lambda x: (x['variant'] == 'target') & (x['days'] == n)]
    count = np.array([target['converted'].sum(), control['converted'].sum()])
    nobs = np.array([target['users'].sum(), control['users'].sum()])
    data_fraction = (target['users'].sum() + control['users'].sum()) / (full_sample_size * 2)

    z_stat, p_value = smp.proportions_ztest(count, nobs, alternative='two-sided')
    ## O'Brien & Fleming function
    ld_of = ld_of_bounds(data_fraction)
    ## Pocock function
    ld_pck = ld_pocock_bounds(data_fraction)

    results_list.append({
        'days': n,
        'fraction': data_fraction,
        'z_score': z_stat,
        'p_value': p_value,
        'of_z_bound': round(ld_of[0], 4),
        'of_p_bound': round(ld_of[1], 4),
        'pck_z_bound': round(ld_pck[0], 4),
        'pck_p_bound': round(ld_pck[1], 4),
    })

# Return results
df_bounds = pd.DataFrame(results_list)
print(df_bounds)
days fraction z_score p_value of_z_bound of_p_bound pck_z_bound pck_p_bound
1 0.187727 -1.483407 0.137966 5.0422 0.0000 2.6973 0.0070
3 0.264545 -1.483820 0.137857 4.2036 0.0000 2.5983 0.0094
5 0.319545 -1.349307 0.177238 3.7965 0.0001 2.5446 0.0109
7 0.388182 -1.430780 0.152493 3.4130 0.0006 2.4900 0.0128
9 0.441364 -1.693298 0.090399 3.1781 0.0015 2.4545 0.0141
11 0.539091 -1.926354 0.054060 2.8383 0.0045 2.4001 0.0164
13 0.572727 -2.007420 0.044705 2.7414 0.0061 2.3839 0.0171
15 0.620909 -2.057154 0.039671 2.6160 0.0089 2.3625 0.0182
17 0.720455 -2.316393 0.020537 2.3966 0.0165 2.3237 0.0201
19 0.801364 -2.497403 0.012511 2.2481 0.0246 2.2965 0.0216
21 0.883182 -2.662860 0.007748 2.1182 0.0342 2.2721 0.0231
23 0.911818 -2.728782 0.006357 2.0768 0.0378 2.2641 0.0236
25 0.975455 -2.905757 0.003664 1.9910 0.0465 2.2475 0.0246
27 1.035455 -2.941648 0.003265 1.9600 0.0500 2.2329 0.0256It looks like the experiment crossed the significance boundaries between days 17 and 19, coincidentally for both Pocock and O’Brien & Fleming functions.
- Let’s plot the results, for a clearer view:
# Plot boundaries and results
fig, ax = plt.subplots(1, 2, figsize=(10,4))

## Z-statistics
ax[0].fill_between(df_bounds['days'], -df_bounds['of_z_bound'], df_bounds['of_z_bound'], color='steelblue', alpha=0.2)
ax[0].fill_between(df_bounds['days'], -df_bounds['pck_z_bound'], df_bounds['pck_z_bound'], color='purple', alpha=0.2)
sns.lineplot(data=df_bounds, x='days', y='z_score', marker='.', color='green', ax=ax[0])

## P-values
ax[1].fill_between(df_bounds['days'], -df_bounds['of_p_bound'], df_bounds['of_p_bound'], color='steelblue', alpha=0.2)
ax[1].fill_between(df_bounds['days'], -df_bounds['pck_p_bound'], df_bounds['pck_p_bound'], color='purple', alpha=0.2)
sns.lineplot(data=df_bounds, x='days', y='p_value', marker='.', color='green', ax=ax[1])

## Legend
legend_elements = [
    pltp.Patch(facecolor='steelblue', alpha=0.3, label="O'Brien & Fleming"),
    pltp.Patch(facecolor='purple', alpha=0.3, label='Pocock'),
]
plt.legend(handles=legend_elements, loc='upper right')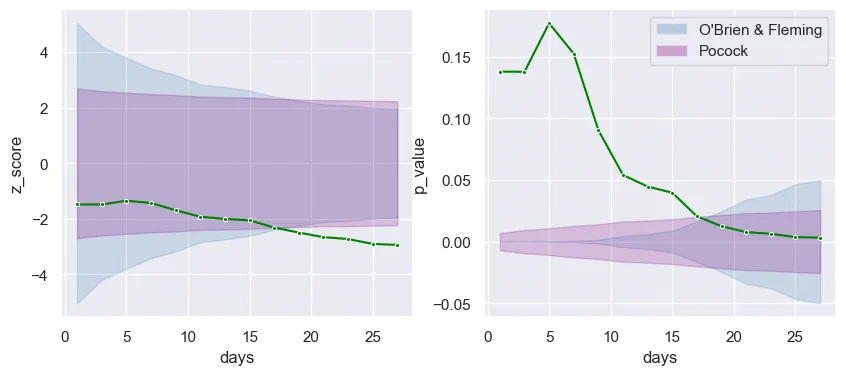
This visually confirms that between day 17 and day 19, the z-score crosses both boundaries, and conversely the p-value enters the boundaries funnel. At this point, we can safely conclude that there is a significant difference between Control and Target groups, and the experiment may be stopped with only 80% of the full sample size.