#120 years of Olympic medals
Project
The Rio Olympics ended yesterday. During two weeks, I checked the medal table every day. So I wanted to see this table over a longer period: which countries won the most medals since the first modern Olympics, in Athens in 1896?
Wikipedia has a medal table for each Olympics. I scraped the 28 tables, from 1896 to 2016. Then I made two graphs with the 8 countries that won the most medals in total. All the other countries are in one group, "Rest of the world".
Some countries changed over time, so I merged them:
- Soviet Union / Russia: the Soviet Union, the Unified Team (1992) and Russia
- Germany: Germany, West Germany, East Germany and the United Team of Germany (1956 to 1964)
Results
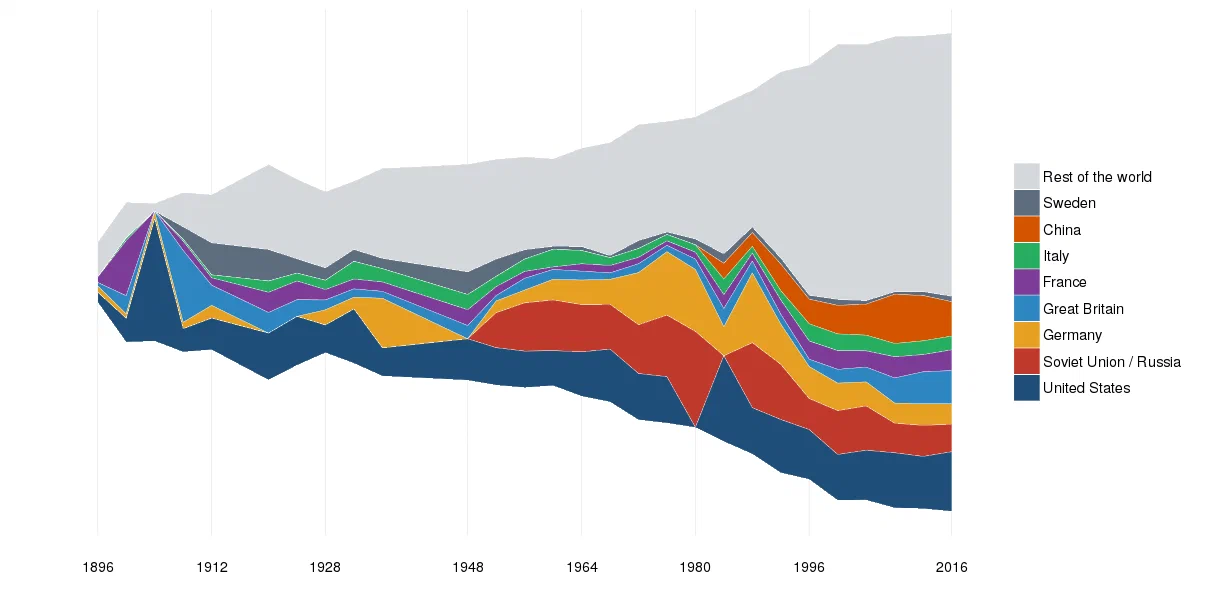
The size of the graph is the number of medals. It grows a lot: 122 medals in 1896, 972 medals in 2016, because there are more and more events. The United States are always there. The Soviet Union and Germany are very strong from the 1950s to the 1980s. China arrives in 1984, at its first Olympics.
The second graph shows the share of medals of each country, for each Olympics:
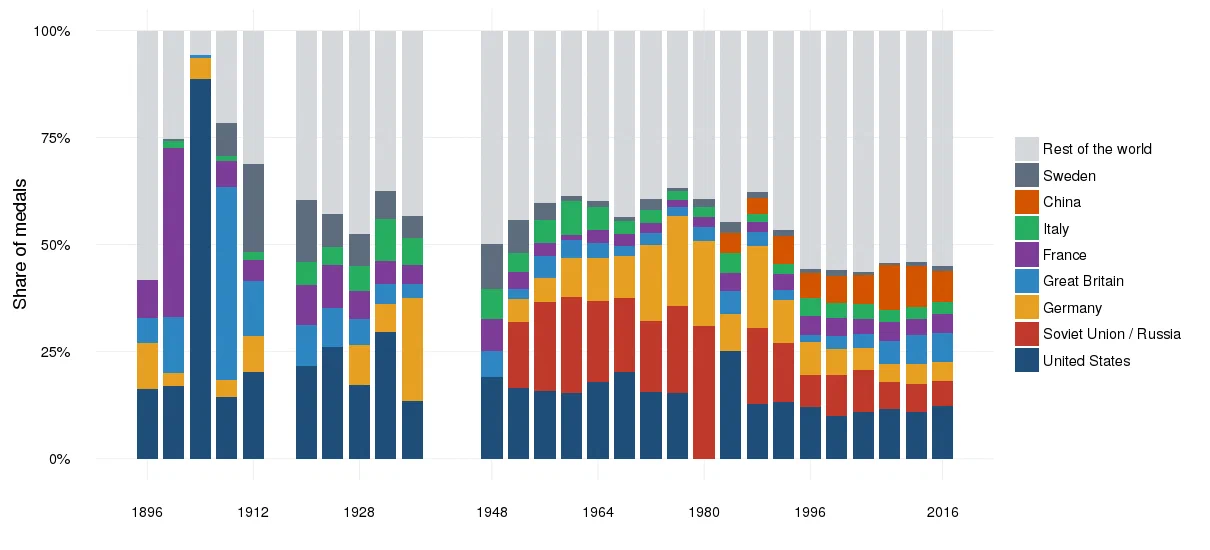
What I see in the data:
- The host country won a lot of medals in the first Olympics. France won 39% of the medals in Paris in 1900, the United States 89% in St. Louis in 1904, and Great Britain 45% in London in 1908. Today it is much less: China won 10% of the medals in Beijing in 2008, and Great Britain 7% in London in 2012.
- The Cold War is very visible. From 1952 to 1988, the Soviet Union, the United States and Germany won about half of the medals. We can also see the boycotts: no American medals in Moscow in 1980, and no Soviet medals in Los Angeles in 1984.
- More countries win medals. The "Rest of the world" won about 40% of the medals in the 1970s, and 55% today. In Rio, 86 countries won at least one medal. In Montreal in 1976, only 41 countries did.
- The United States are very stable. They win between 10% and 20% of the medals in most Olympics, for more than 100 years.
Full Code
Data scraping
# Load libraries
library('rvest')
library('dplyr')
library('tidyr')
library('stringr')
library('ggplot2')

# All Olympic years (no Games in 1916, 1940 and 1944)
years <- setdiff(seq(1896, 2016, by = 4), c(1916, 1940, 1944))

# Empty dataframe to stock information
medals <- data.frame()

# Loop to scrape every page
for (i in years) {

    page <- read_html(paste0("https://en.wikipedia.org/wiki/", i, "_Summer_Olympics_medal_table"))

    # Keep the table with the medals, and read its rows one by one
    table <- xml_find_first(page, "//table[contains(@class, 'wikitable')][.//th[contains(., 'Gold')]]")
    rows <- lapply(xml_find_all(table, ".//tr"), function(tr) xml_text(xml_find_all(tr, "./th|./td"), trim = TRUE))

    # The last 5 cells are: country, gold, silver, bronze, total (the rank can be shared by several rows)
    rows <- Filter(function(r) length(r) >= 5 && all(grepl("^[0-9]+$", tail(r, 4))), rows)
    rawlist <- data.frame(do.call(rbind, lapply(rows, tail, 5)), stringsAsFactors = FALSE)
    names(rawlist) <- c("Country", "Gold", "Silver", "Bronze", "Total")

    # Clean dataframe
    rawlist <-
        rawlist %>%
        # Delete "Total" line
        filter(!str_detect(Country, "Total")) %>%
        # Remove host and footnote marks, keep relevant columns
        transmute(Year = i,
                  Country = str_trim(str_replace_all(Country, "[*ࠤ#]|\\[.*?\\]", "")),
                  Medals = as.integer(Total))

    medals <- bind_rows(medals, rawlist)
    Sys.sleep(1)
}Data cleaning
# Merge countries that changed over time
groups <- c("Soviet Union" = "Soviet Union / Russia",
            "Unified Team" = "Soviet Union / Russia",
            "Russia" = "Soviet Union / Russia",
            "West Germany" = "Germany",
            "East Germany" = "Germany",
            "United Team of Germany" = "Germany")

medals <-
    medals %>%
    mutate(Group = ifelse(Country %in% names(groups), unname(groups[Country]), Country))

# Top 8 countries of all time
top_countries <-
    medals %>%
    group_by(Group) %>%
    summarise(Medals = sum(Medals)) %>%
    arrange(desc(Medals)) %>%
    head(8)
top_countries <- top_countries$Group

# Other countries in "Rest of the world"
graphdata <-
    medals %>%
    mutate(Country = ifelse(Group %in% top_countries, Group, "Rest of the world")) %>%
    group_by(Year, Country) %>%
    summarise(Medals = sum(Medals)) %>%
    ungroup() %>%
    complete(Year, Country, fill = list(Medals = 0)) %>%
    mutate(Country = factor(Country, levels = rev(c(top_countries, "Rest of the world")))) %>%
    # United States at the bottom, rest of the world at the top
arrange(Year, desc(Country))Graphs
For the streamgraph, I put the areas on top of each other, and moved them down by half of the total, so the graph is centred on zero:
colours <- rev(c("#1f4e79", "#c0392b", "#e6a023", "#2e86c1", "#7d3c98",
                 "#27ae60", "#d35400", "#5d6d7e", "#d5d8dc"))

# Streamgraph: stacked areas, centred on zero
streamdata <-
    graphdata %>%
    group_by(Year) %>%
    mutate(ymax = cumsum(Medals) - sum(Medals) / 2,
           ymin = ymax - Medals) %>%
    ungroup()

ggplot(streamdata, aes(x = Year, ymin = ymin, ymax = ymax, fill = Country)) +
    geom_ribbon(colour = "white", size = 0.1) +
    scale_fill_manual(values = colours) +
    labs(x = "", y = "", fill = "") +
    theme_minimal() +
    theme(axis.text.y = element_blank())

# Share of medals
ggplot(graphdata, aes(x = Year, y = Medals, fill = Country)) +
    geom_bar(stat = "identity", position = "fill", width = 3.2) +
    scale_fill_manual(values = colours) +
    scale_y_continuous(labels = scales::percent) +
    labs(x = "", y = "Share of medals", fill = "") +
    theme_minimal()