#Plot great categorical distribution graphs with Python seaborn
Seaborn offers a variety of plots for showing the distribution of categorical variables. Let’s walk through some of them, from simplest to most detailed.
Setup
# Import libraries
import pandas as pd
import seaborn as sns

# Set plots size
sns.set(rc={'figure.figsize':(9,6)})

# Load sample data
df = sns.load_dataset('tips')
df.tail()| total_bill | tip | sex | smoker | day | time | size | |
|---|---|---|---|---|---|---|---|
| 239 | 29.03 | 5.92 | Male | No | Sat | Dinner | 3 |
| 240 | 27.18 | 2.00 | Female | Yes | Sat | Dinner | 2 |
| 241 | 22.67 | 2.00 | Male | Yes | Sat | Dinner | 2 |
| 242 | 17.82 | 1.75 | Male | No | Sat | Dinner | 2 |
| 243 | 18.78 | 3.00 | Female | No | Thur | Dinner | 2 |
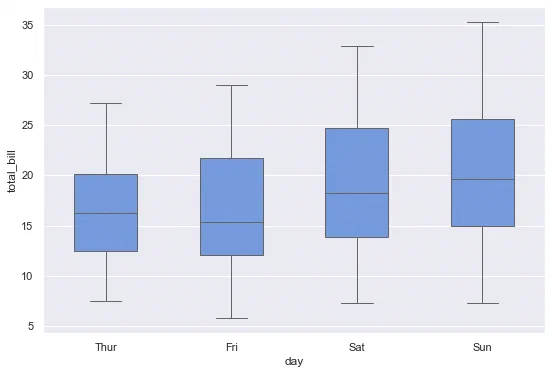
Boxplot
The classic. A number of parameters can be tuned to adjust proportions and outliers display.
# Boxplot
sns.boxplot(
    data=df, y='total_bill', x='day',
    whis=1,                   # Whiskers extent vs IQR
    showfliers=False,         # Hide outliers markers
    width=.5,                 # Boxes width
    color='cornflowerblue',   # Avoid rainbow effect
    linewidth=1               # Line width
);
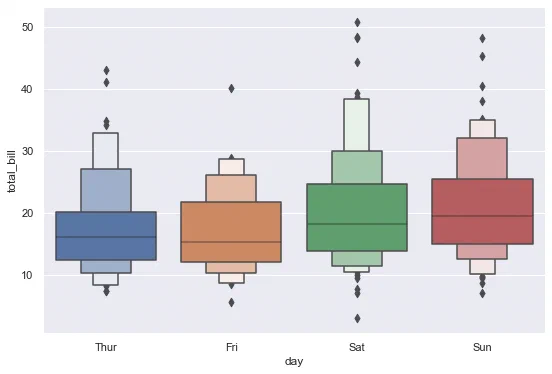
Boxenplot
An “advanced” version of the boxplot, that displays a number of percentiles as small boxes, to show more detail about the distribution.
# Boxenplot
sns.boxenplot(
    data=df, y='total_bill', x='day',
    k_depth=3   # Fixed number of percentiles to draw
);
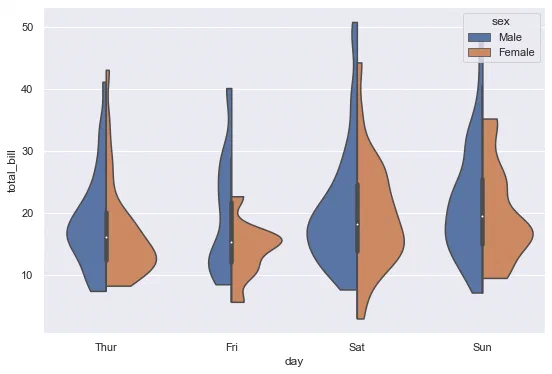
Violinplot
Violinplots combine boxplots and kernel density estimates, and are an interesting intermediary solution between simple boxplots and detailed stripplots.
# Violinplot
sns.violinplot(
    data=df, y='total_bill', x='day',
    hue='sex', split=True,   # Split by gender
    cut=0,                   # Do not extend density past extreme values
    inner='box',             # Inner plot type
    bw=.35                   # "Flexibility" of kernel bandwidth
);
Stripplot
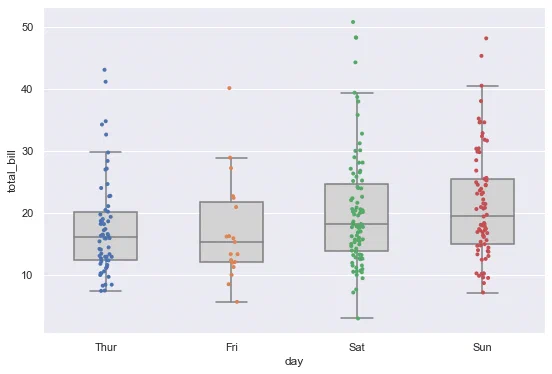
Stripplots show every data point. It can be a good idea to combine them with more a simple representation like boxplots.
# Boxplot + stripplot
sns.boxplot(
    data=df, y='total_bill', x='day',
    width=.5, showfliers=False, color='lightgray'
)
sns.stripplot(
    data=df, y='total_bill', x='day',
    size=4,      # Custom point radius
    jitter=.05   # Amount of jitter to avoid overlap
);
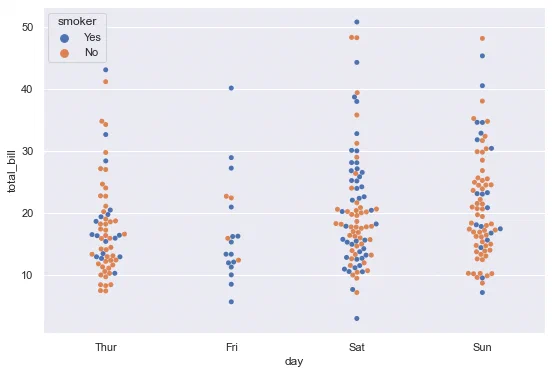
Swarmplot
Swarmplot are like stripplots, but with points adjustment to avoid overlapping.
# Swarmplot
sns.swarmplot(data=df, y='total_bill', x='day', hue='smoker');